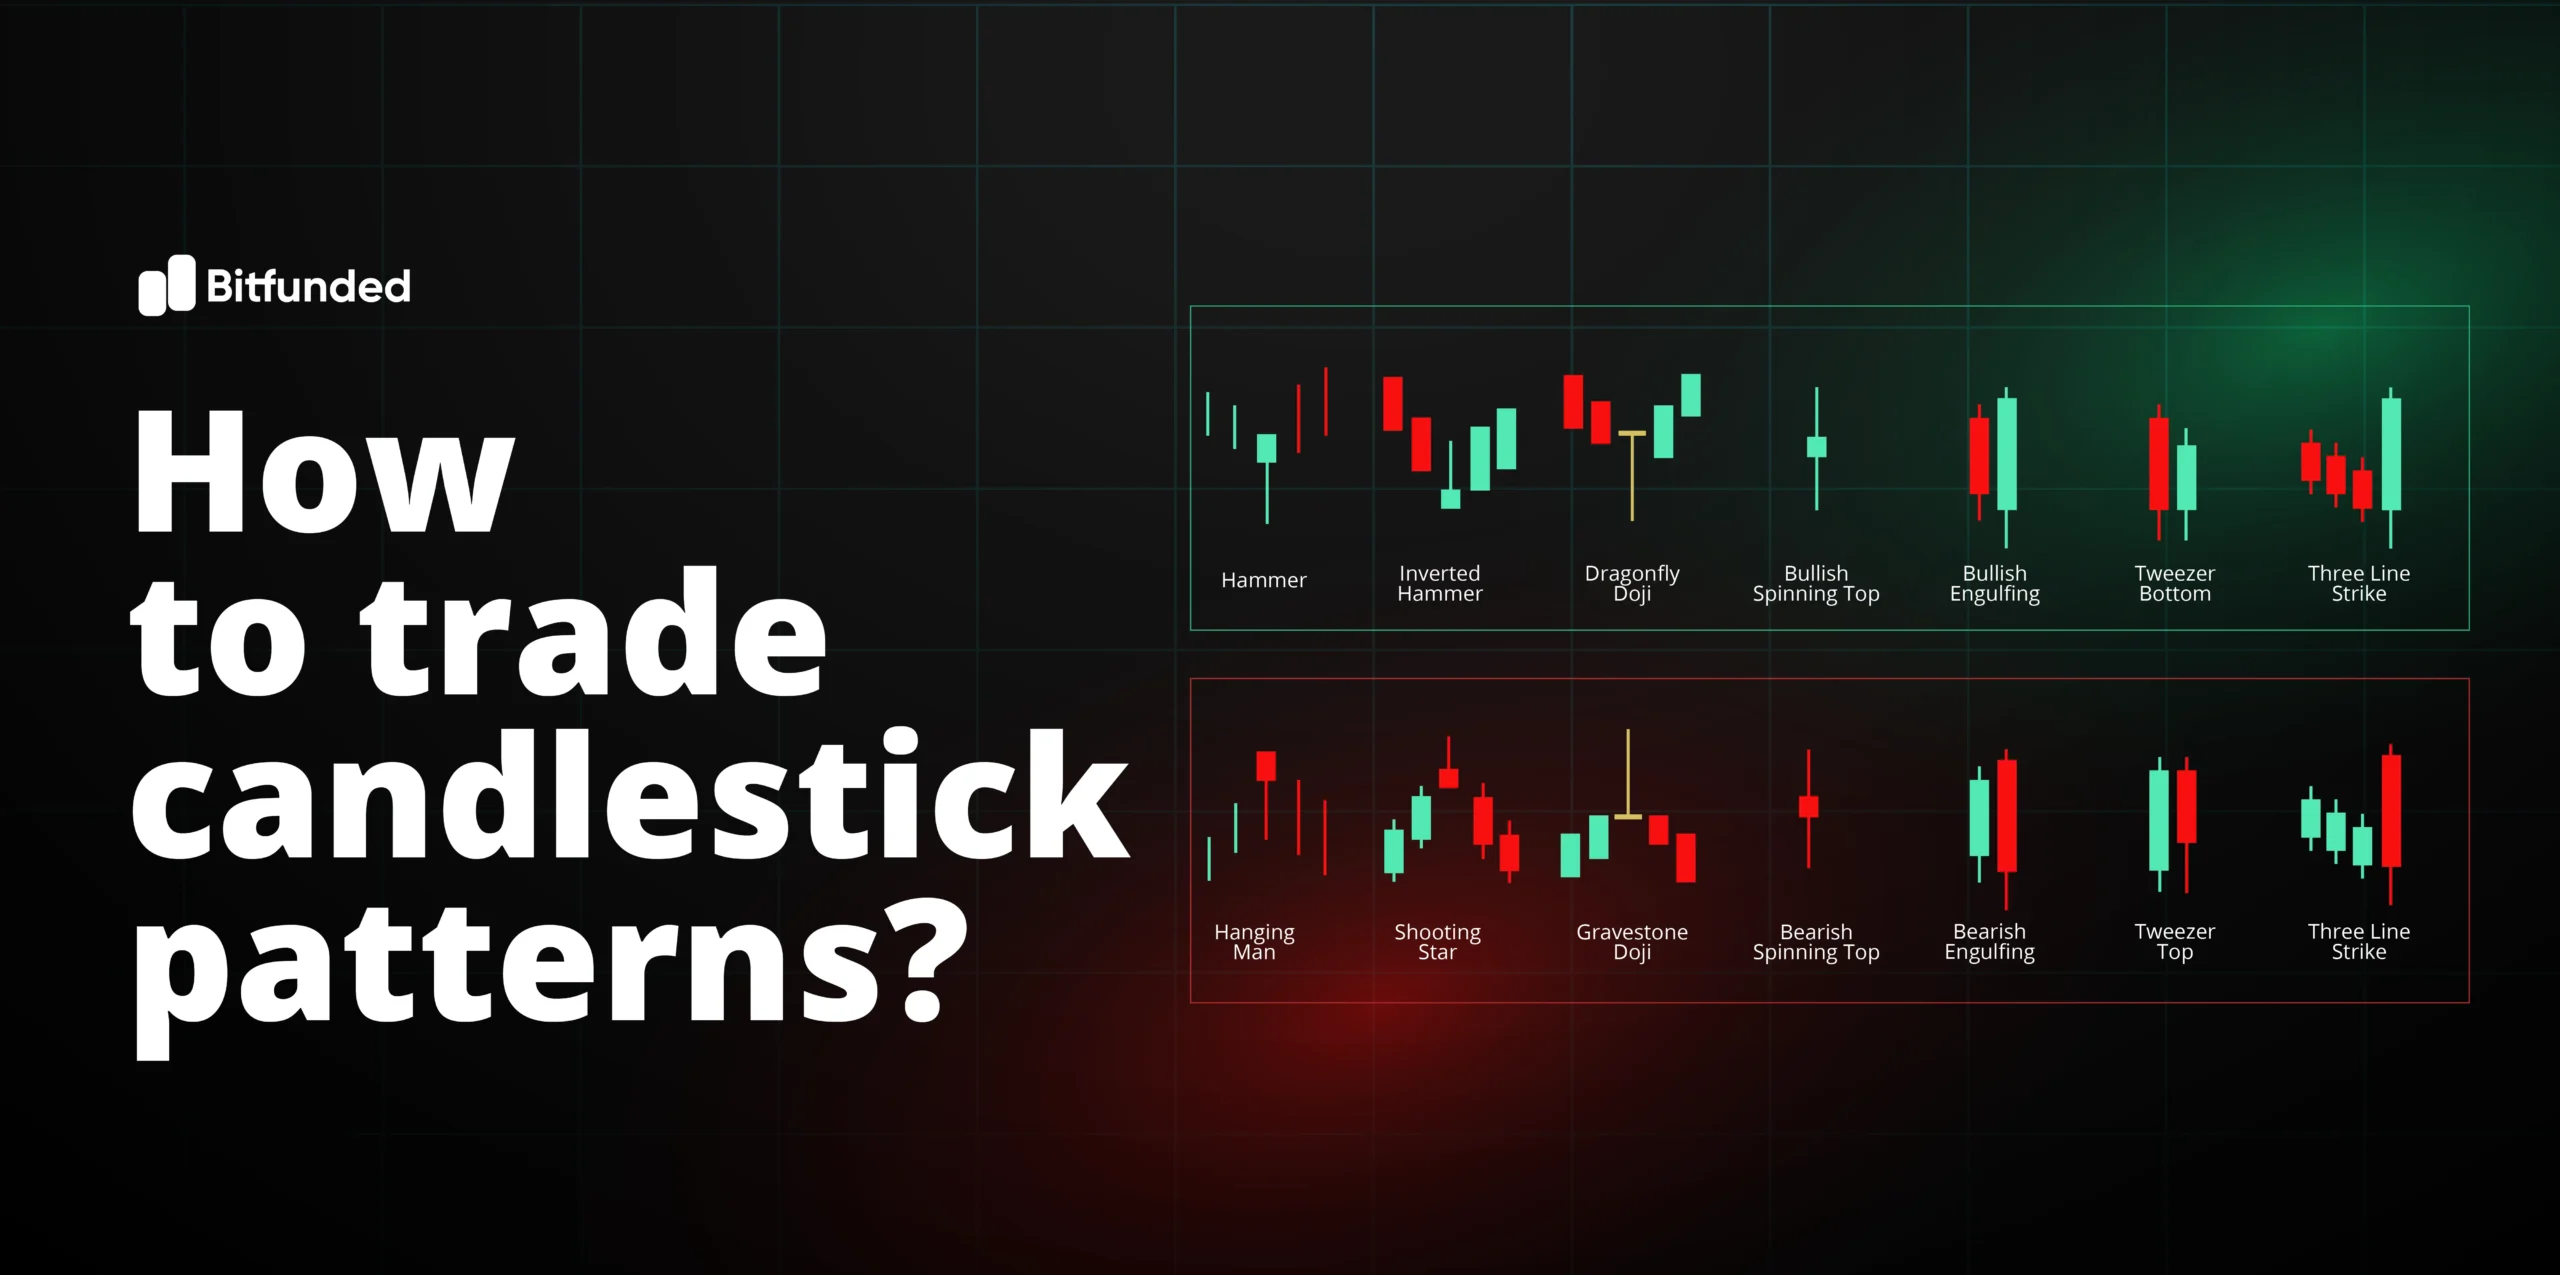
One of the keys in trading that few people tell you is that to increase your chances of success in crypto trading, it’s essential to find price confirmations that indicate a clear market direction.
As you may know, in trading, there are hundreds of different types of charts. However, Japanese candlesticks, besides being the most common, are often the most used by professional traders.
Have you ever imagined being able to predict the next Bitcoin trend by understanding candlestick patterns? Here, I’ll share some secrets:
Candlestick Patterns
For understanding, Japanese candlesticks show four key price points during a specific period: opening price, closing price, and highest and lowest prices reached during that frame.
However, the important thing to improve your skills as a trader is that there are several candlestick patterns. As shown in the guide, there are individual, double, or triple candlestick patterns. A key point is that the more candles involved, the stronger the pattern may be.
The Secret to Trading Candlestick Patterns
To succeed in trading, you must know the best confirmation points to enter and exit the market. To spot these confirmations like a pro, consider these three steps:
- Time Frame: Candlestick patterns have the same meaning in any time frame. However, in lower time frames, it’s common to encounter more manipulation, making these patterns less effective for traders.
- Candle Closes: Once the price reaches a fundamental level, you should pay attention to a support or resistance level. If you’re looking for a price reversal, a candlestick pattern must form in this zone.
- Candlestick Patterns: As indicated in the guide, certain candlestick formations can signal that the price has enough strength to continue in a particular direction. If you identify one of these patterns significantly, you can take it as confirmation and enter or exit a trade optimally.

